> ## Documentation Index
> Fetch the complete documentation index at: https://wukong.mintlify.site/llms.txt
> Use this file to discover all available pages before exploring further.
# Stress Testing
> Learn how to perform stress testing on WuKongIM, including configuration, stress tester installation, running tests and analyzing reports
# Stress Testing
WuKongIM stress testing functionality is only available in versions v2.1.2-20250120 and above
## Server Stress Configuration
WuKongIM server new configuration:
```yaml wk.yaml theme={null}
...
stress: true
intranet:
tcpAddr: "ip:port"
...
```
```yaml environment theme={null}
WK_STRESS=true
WK_INTRANET_TCPADDR=ip:port
```
### Configuration Description
**`stress`**
Enable stress testing configuration. Only when enabled can the server be stress tested.
**`intranet.tcpAddr`**
* **No load balancer configured (single node mode)**: `tcpAddr` is WuKongIM server's internal IP + port 5100, e.g.: 192.168.1.12:5100
* **Load balancer configured (distributed mode)**: `tcpAddr` is load balancer's internal IP + port 15100, e.g.: 192.168.1.11:15100
## Install Stress Tester
### Configuration Requirements
Stress tester requires a server with large memory, recommended 4 cores 16GB or above.
### Installation Steps
**1. Download Executable File**
```bash amd64 theme={null}
sudo curl -L -o wkstress https://github.com/WuKongIM/StressTester/releases/download/v1.1.0/wkstress-linux-amd64
```
```bash arm64 theme={null}
sudo curl -L -o wkstress https://github.com/WuKongIM/StressTester/releases/download/v1.1.0/wkstress-linux-arm64
```
**2. Modify Executable File Permissions**
```bash theme={null}
sudo chmod +x wkstress
```
### Run Stress Tester
**Start**
```bash theme={null}
nohup ./wkstress &
```
Port: 9466
**Stop**
```bash theme={null}
kill -9 $(lsof -t -i :9466)
```
## Start Stress Testing
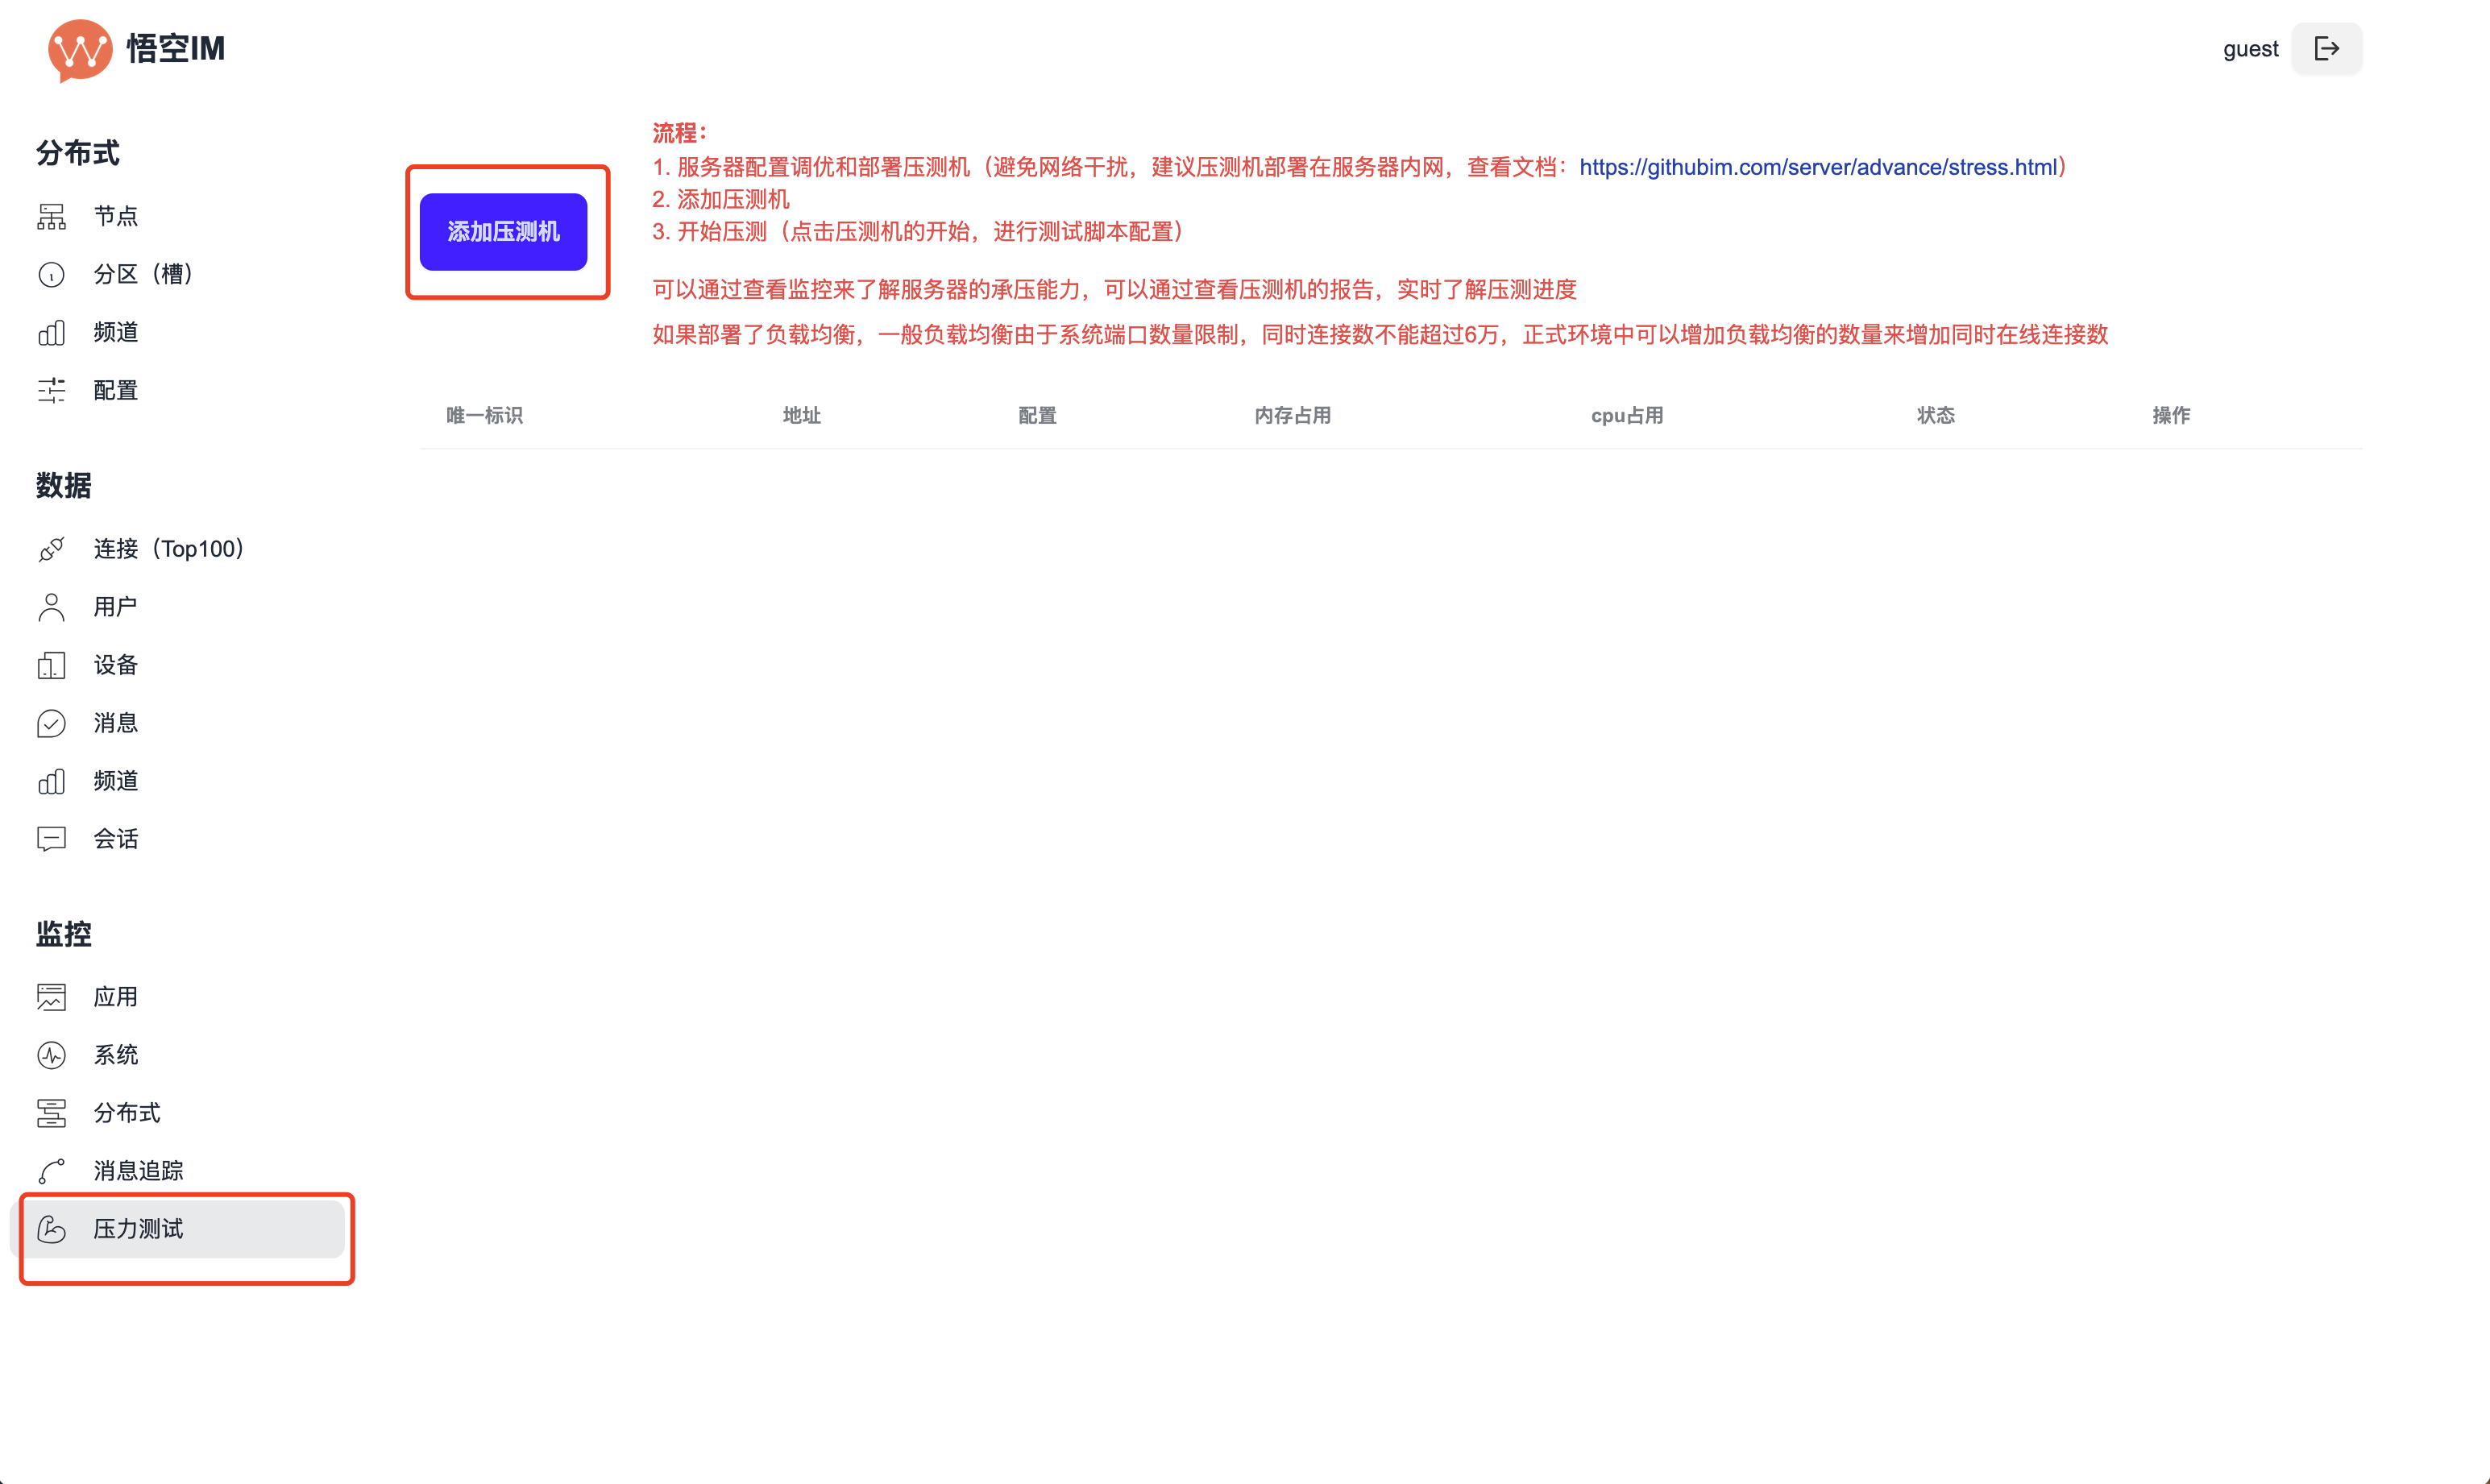
### 1. Add Stress Testing Machine
Address: `http://ip:9466`, where ip is the **internal IP** of the stress testing machine, as shown below:
 ### 2. Set Stress Testing Metrics and Run
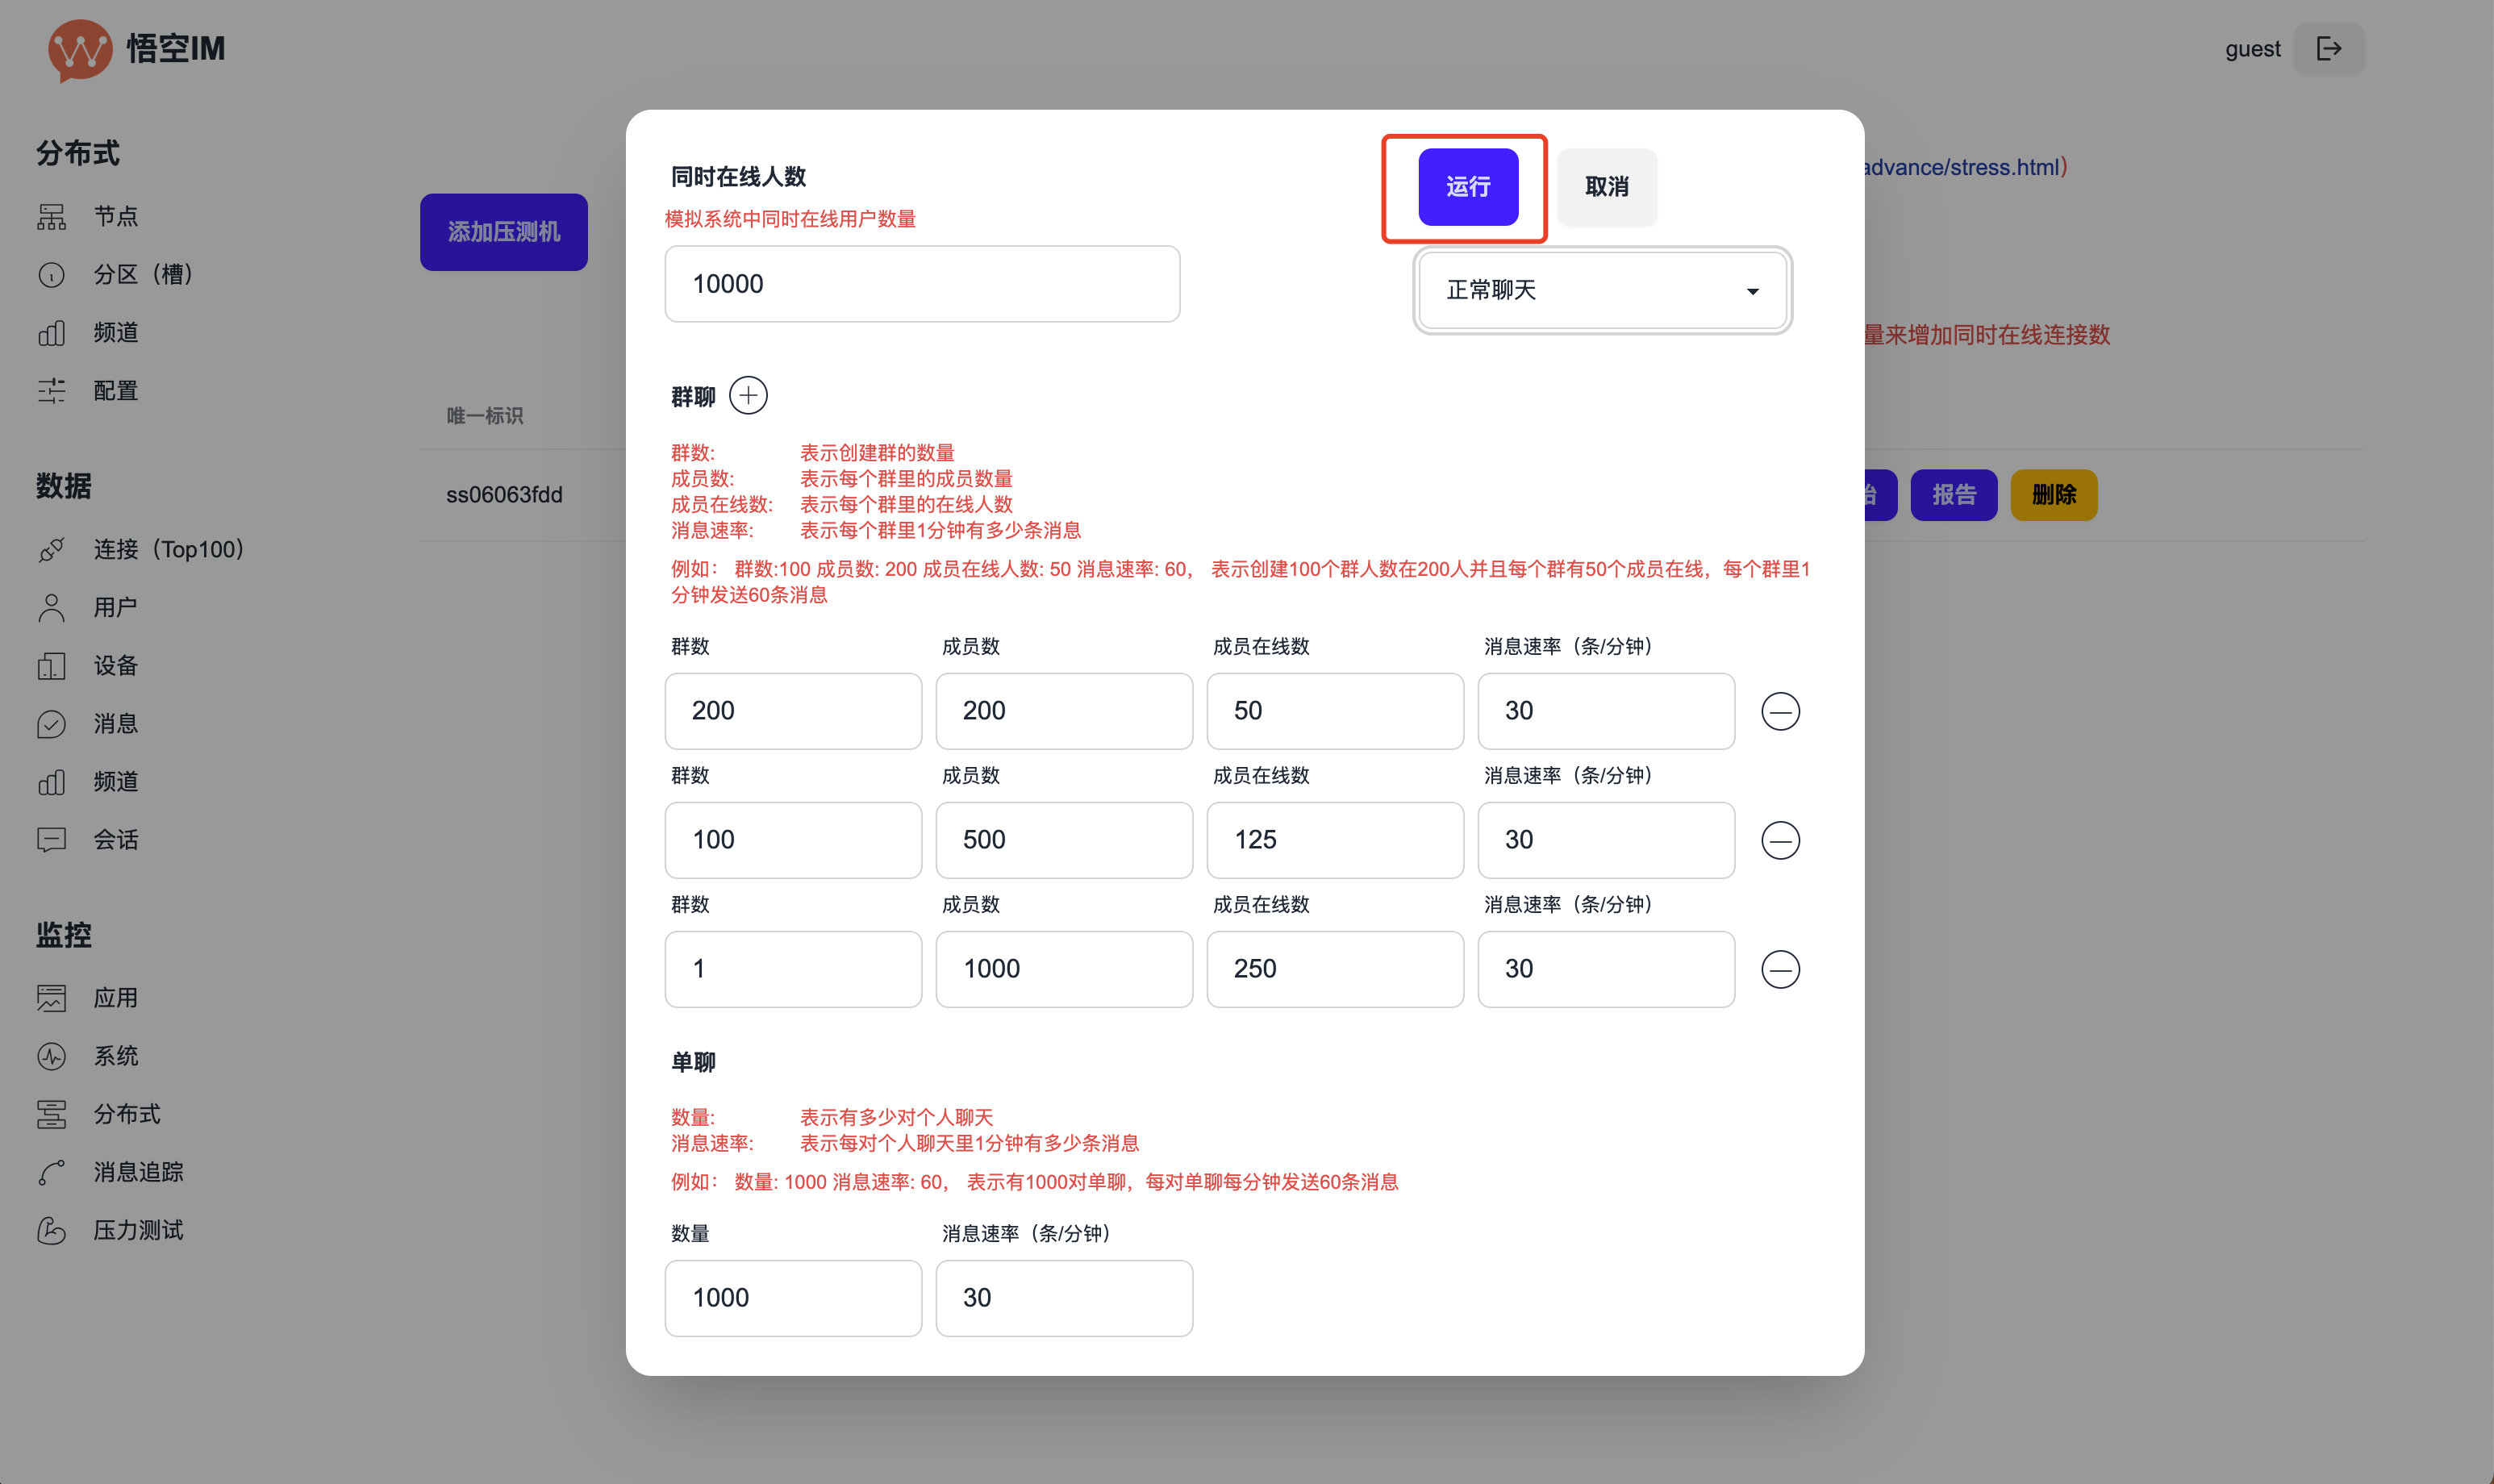
Set stress testing metrics and run, as shown below:
### 2. Set Stress Testing Metrics and Run
Set stress testing metrics and run, as shown below:
 ## View Stress Testing Report
 ### Report Field Explanation
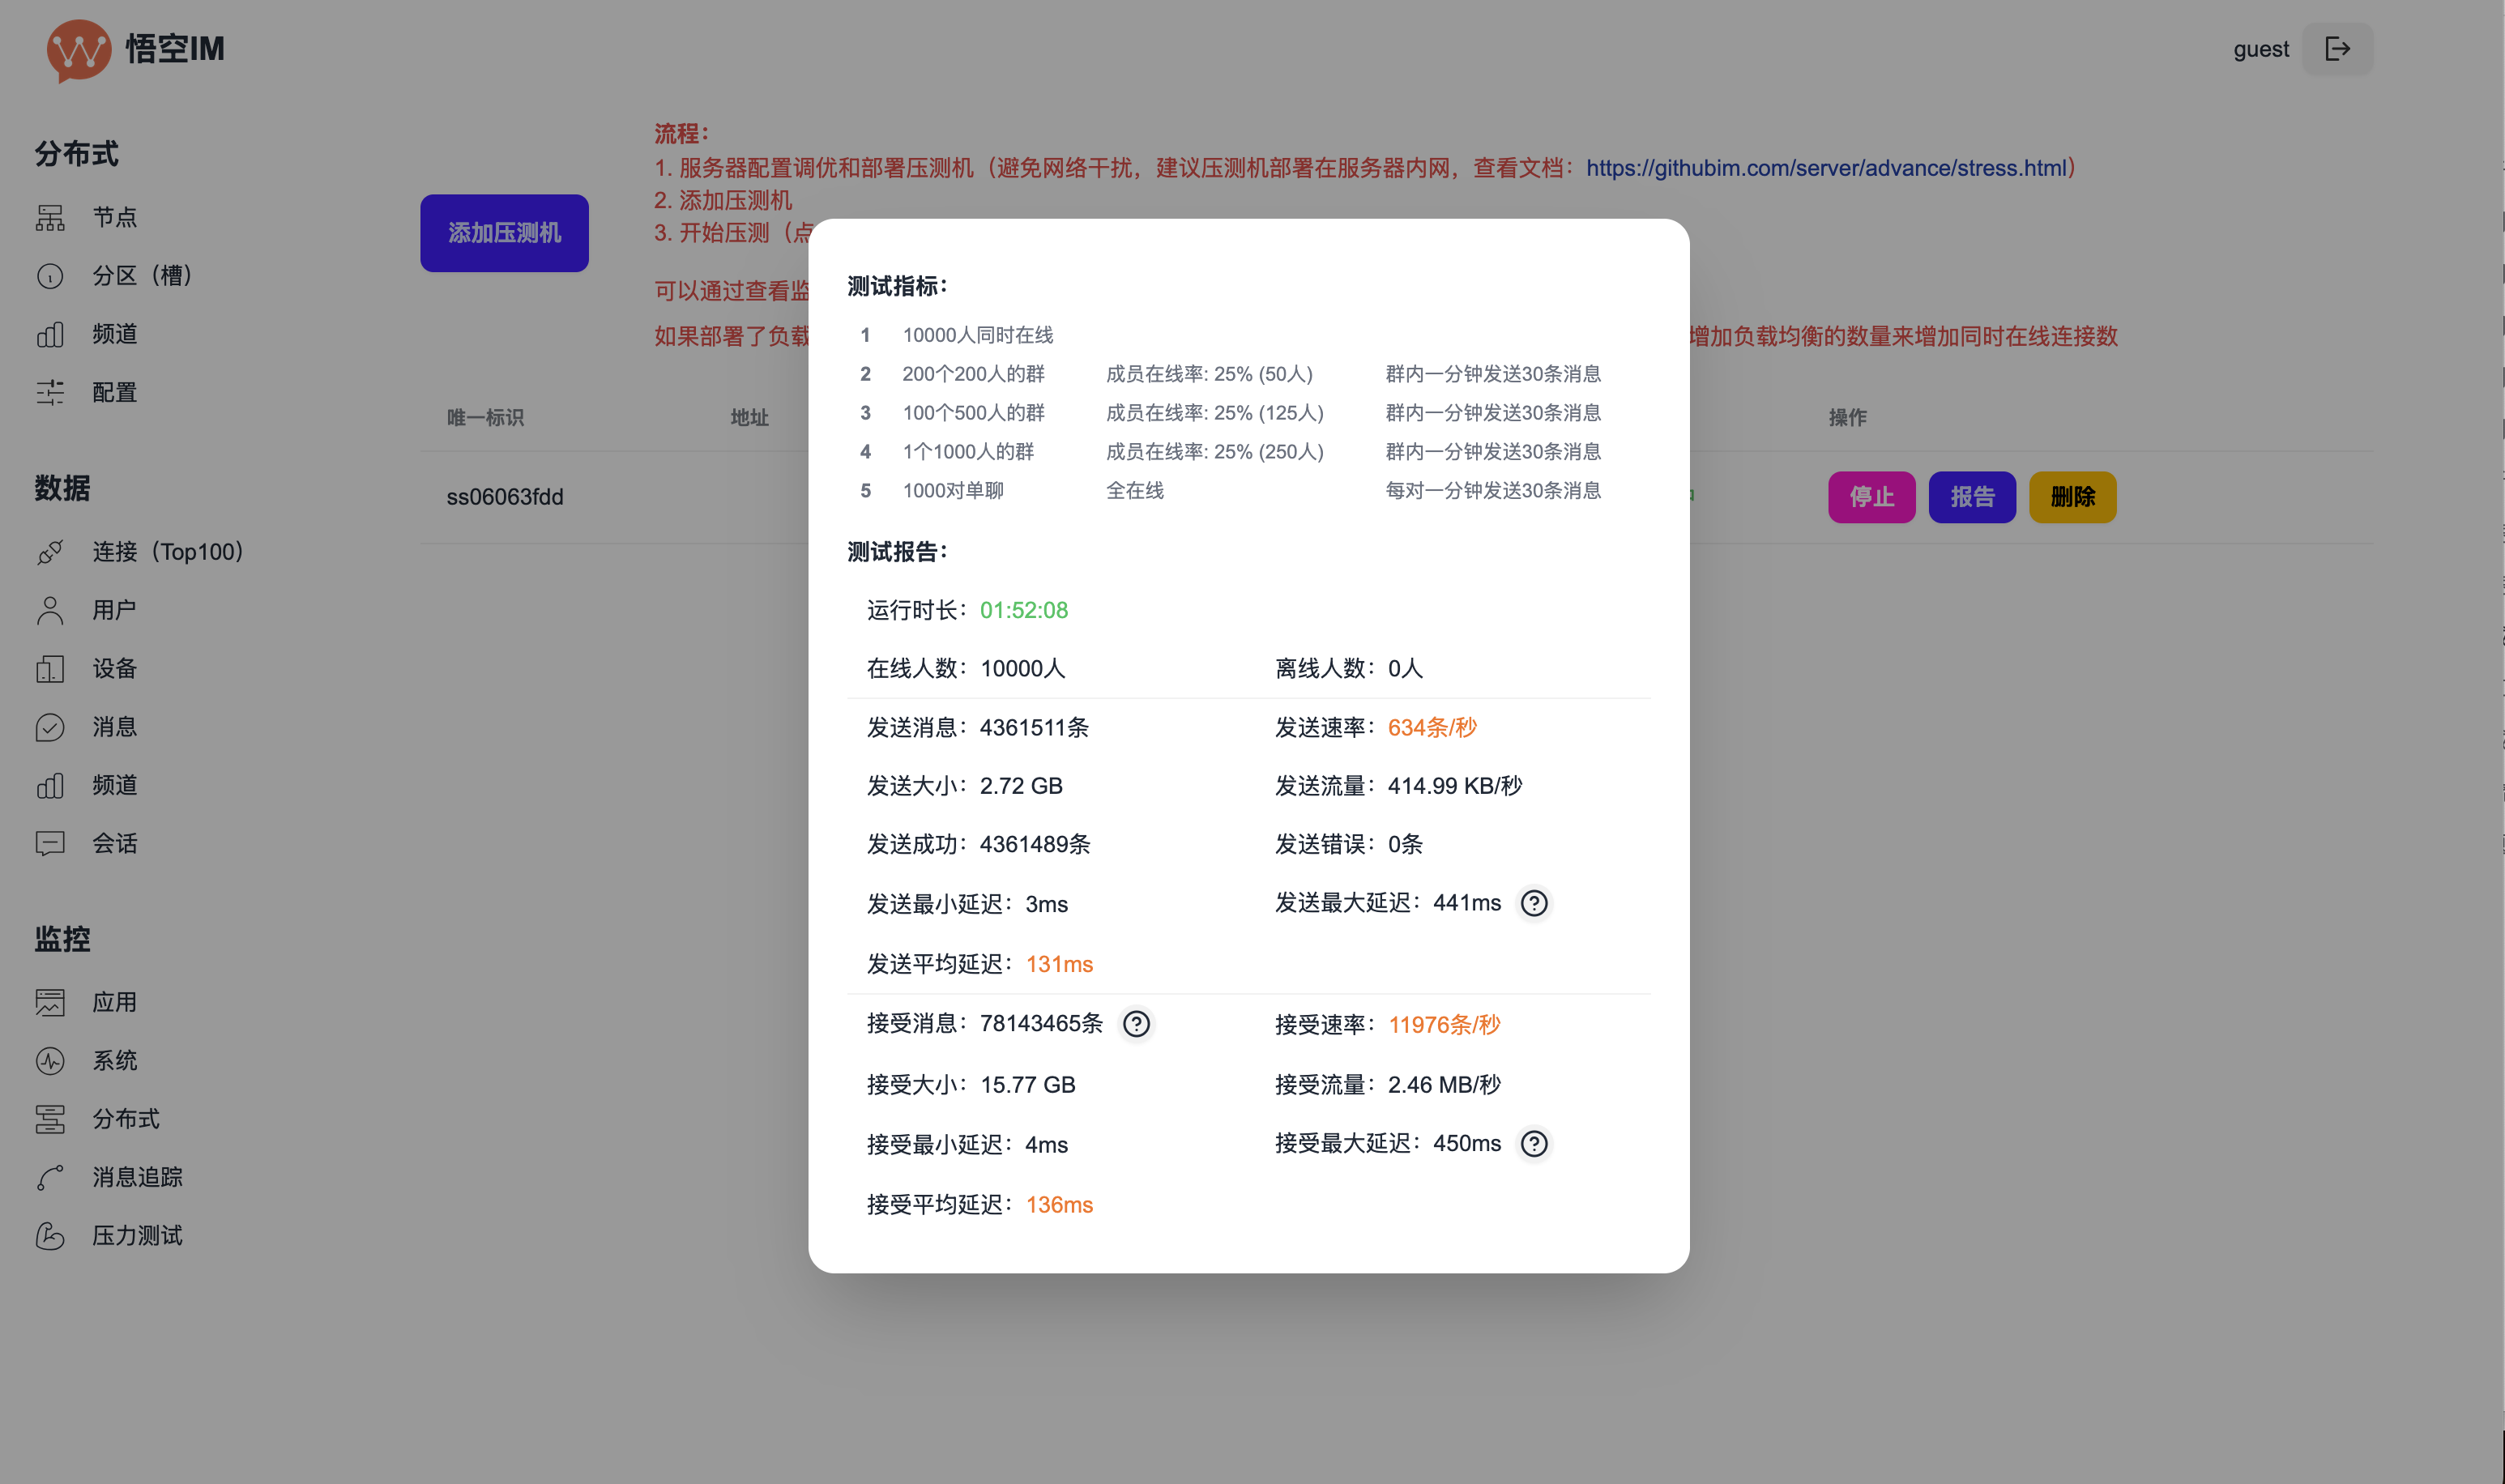
**Test Metrics**
Represents the stress testing data currently being tested by the stress tester.
**Test Report**
* **Runtime**: Duration since stress testing started
* **Online Users**: Number of simulated concurrent online users
* **Offline Users**: Number of simulated online users that have disconnected
* **Sent Messages**: Total number of messages sent to server
* **Send Rate**: Current rate of messages sent to server
* **Send Size**: Total size of sent messages
* **Send Traffic**: Current bandwidth real-time traffic of sent messages
* **Send Success**: Number of messages that received successful response from server after sending
* **Send Errors**: Number of messages that received failed response from server after sending
* **Send Min Latency**: Minimum round-trip time from sending message to server until receiving server response
* **Send Max Latency**: Maximum round-trip time from sending message to server until receiving server response
* **Send Avg Latency**: Average round-trip time from sending message to server until receiving server response
* **Received Messages**: Total number of messages received
* **Receive Rate**: Current rate of messages received
* **Receive Size**: Total size of received messages
* **Receive Traffic**: Current bandwidth traffic of received messages
* **Receive Min Latency**: Minimum time from sending message until subscriber receives message
* **Receive Max Latency**: Maximum time from sending message until subscriber receives message
* **Receive Avg Latency**: Average time from sending message until subscriber receives message
## Report Analysis
### Core Metrics Analysis
#### Send Rate
Also known as send message concurrency.
**Description**
This metric shows the server's ability to handle concurrent messages. The higher the value, the stronger the server's concurrency capability, and the more users can send messages simultaneously per second.
Based on the following algorithm, you can roughly estimate the relationship between `send rate` and `Daily Active Users (DAU)`:
```
Peak Concurrency = DAU × Peak Active User Ratio × Send Rate Per User
```
**Assumptions**:
* Daily Active Users (DAU): 100,000 people
* Peak online user ratio: approximately 10%~20%, take 15%
* Send rate per user per minute ~= 6 messages/minute = 0.1 messages/second
**Then**:
`Peak message sending concurrency = 100,000 × 0.15 × 0.1 = 1,500 messages/second`
**Conclusion**:
`A send rate around 1,500 messages/second can support approximately 100,000 daily active users.`
By adjusting peak online user ratio and send rate per user, you can roughly estimate your peak send rate, and indirectly verify through stress testing whether the server can meet your daily active user requirements.
#### Receive Rate
Also known as receive message concurrency.
**Description**
This metric shows the server's ability to deliver messages concurrently. The higher the value, the stronger the server's concurrency capability, and the more private chats and group chats it can support simultaneously.
For group chat or broadcast scenarios, one message may be received by multiple users. Therefore, receive concurrency also needs to be calculated:
```
Peak Receive Message Concurrency = Peak Active Group Count × Average Online Members Per Group × Message Send Frequency Per Group
```
**Assumptions**:
* Daily active group chat count: 10,000 groups
* Average online members per group: 20 people
* Peak active group ratio: approximately 10%~20%, take 15%
* Message send frequency per group: 0.5 messages/second
**Then**:
`Peak receive message concurrency = 10,000 × 20 × 0.15 × 0.5 = 15,000 messages/second`
**Conclusion**:
`Message receive rate around 15,000 messages/second can support approximately 10,000 daily active groups with 20 online members each`
Through this formula + stress tester + daily active group chats, you can stress test the required server resource configuration.
#### Send Success and Errors
`Send success and failure` refers to the result from when client starts sending message until server receives and stores it, then returns success or failure to client.
`This metric reflects server health. Higher send success rate indicates healthier system.`
#### Send and Receive Average Latency
`This metric observes server stability`
Lower average latency indicates more stable system.
#### Send Success and Expected Received Message Count
`This metric observes whether there are missing messages`
Expected received message count can be viewed by clicking the question mark next to the receive message metric.
After stopping stress testing, click view report again. If the send success message count in the report equals the expected received message count, it means all messages were received by subscribing clients.
This metric is only meaningful when Send Messages = Send Success
#### Send Traffic and Receive Traffic
`This metric observes the bandwidth size the server needs to support`
## Common Issues
**Answer**: Modify file descriptor limits for WuKongIM and nginx servers
**Check current file descriptor limit**:
```bash theme={null}
ulimit -n
```
**Temporarily modify file descriptor limit**:
```bash theme={null}
ulimit -n 100000
```
**Permanently modify file descriptor limit**:
Edit `/etc/security/limits.conf` file, add the following lines:
```
* soft nofile 100000
* hard nofile 100000
```
Modify `worker_connections` in nginx configuration, can be changed to around 40960
## Related Resources
* [Stress Testing Report](/en/getting-started/stress-report)
* [System Integration Guide](/en/getting-started/learning/system-integration)
* [API Documentation](/en/api/introduction)
### Report Field Explanation
**Test Metrics**
Represents the stress testing data currently being tested by the stress tester.
**Test Report**
* **Runtime**: Duration since stress testing started
* **Online Users**: Number of simulated concurrent online users
* **Offline Users**: Number of simulated online users that have disconnected
* **Sent Messages**: Total number of messages sent to server
* **Send Rate**: Current rate of messages sent to server
* **Send Size**: Total size of sent messages
* **Send Traffic**: Current bandwidth real-time traffic of sent messages
* **Send Success**: Number of messages that received successful response from server after sending
* **Send Errors**: Number of messages that received failed response from server after sending
* **Send Min Latency**: Minimum round-trip time from sending message to server until receiving server response
* **Send Max Latency**: Maximum round-trip time from sending message to server until receiving server response
* **Send Avg Latency**: Average round-trip time from sending message to server until receiving server response
* **Received Messages**: Total number of messages received
* **Receive Rate**: Current rate of messages received
* **Receive Size**: Total size of received messages
* **Receive Traffic**: Current bandwidth traffic of received messages
* **Receive Min Latency**: Minimum time from sending message until subscriber receives message
* **Receive Max Latency**: Maximum time from sending message until subscriber receives message
* **Receive Avg Latency**: Average time from sending message until subscriber receives message
## Report Analysis
### Core Metrics Analysis
#### Send Rate
Also known as send message concurrency.
**Description**
This metric shows the server's ability to handle concurrent messages. The higher the value, the stronger the server's concurrency capability, and the more users can send messages simultaneously per second.
Based on the following algorithm, you can roughly estimate the relationship between `send rate` and `Daily Active Users (DAU)`:
```
Peak Concurrency = DAU × Peak Active User Ratio × Send Rate Per User
```
**Assumptions**:
* Daily Active Users (DAU): 100,000 people
* Peak online user ratio: approximately 10%~20%, take 15%
* Send rate per user per minute ~= 6 messages/minute = 0.1 messages/second
**Then**:
`Peak message sending concurrency = 100,000 × 0.15 × 0.1 = 1,500 messages/second`
**Conclusion**:
`A send rate around 1,500 messages/second can support approximately 100,000 daily active users.`
By adjusting peak online user ratio and send rate per user, you can roughly estimate your peak send rate, and indirectly verify through stress testing whether the server can meet your daily active user requirements.
#### Receive Rate
Also known as receive message concurrency.
**Description**
This metric shows the server's ability to deliver messages concurrently. The higher the value, the stronger the server's concurrency capability, and the more private chats and group chats it can support simultaneously.
For group chat or broadcast scenarios, one message may be received by multiple users. Therefore, receive concurrency also needs to be calculated:
```
Peak Receive Message Concurrency = Peak Active Group Count × Average Online Members Per Group × Message Send Frequency Per Group
```
**Assumptions**:
* Daily active group chat count: 10,000 groups
* Average online members per group: 20 people
* Peak active group ratio: approximately 10%~20%, take 15%
* Message send frequency per group: 0.5 messages/second
**Then**:
`Peak receive message concurrency = 10,000 × 20 × 0.15 × 0.5 = 15,000 messages/second`
**Conclusion**:
`Message receive rate around 15,000 messages/second can support approximately 10,000 daily active groups with 20 online members each`
Through this formula + stress tester + daily active group chats, you can stress test the required server resource configuration.
#### Send Success and Errors
`Send success and failure` refers to the result from when client starts sending message until server receives and stores it, then returns success or failure to client.
`This metric reflects server health. Higher send success rate indicates healthier system.`
#### Send and Receive Average Latency
`This metric observes server stability`
Lower average latency indicates more stable system.
#### Send Success and Expected Received Message Count
`This metric observes whether there are missing messages`
Expected received message count can be viewed by clicking the question mark next to the receive message metric.
After stopping stress testing, click view report again. If the send success message count in the report equals the expected received message count, it means all messages were received by subscribing clients.
This metric is only meaningful when Send Messages = Send Success
#### Send Traffic and Receive Traffic
`This metric observes the bandwidth size the server needs to support`
## Common Issues
**Answer**: Modify file descriptor limits for WuKongIM and nginx servers
**Check current file descriptor limit**:
```bash theme={null}
ulimit -n
```
**Temporarily modify file descriptor limit**:
```bash theme={null}
ulimit -n 100000
```
**Permanently modify file descriptor limit**:
Edit `/etc/security/limits.conf` file, add the following lines:
```
* soft nofile 100000
* hard nofile 100000
```
Modify `worker_connections` in nginx configuration, can be changed to around 40960
## Related Resources
* [Stress Testing Report](/en/getting-started/stress-report)
* [System Integration Guide](/en/getting-started/learning/system-integration)
* [API Documentation](/en/api/introduction)